 Image: grand rapids
Return on Investment
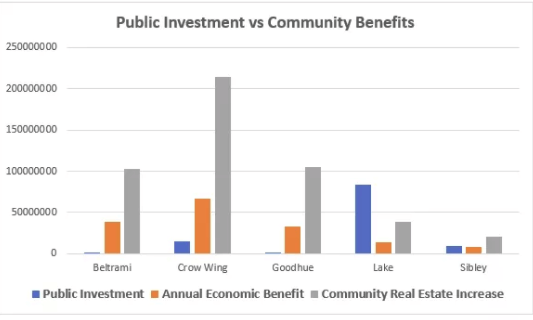
The chart above shows public investment (grants, loans or other public or community funding) compared to benefits experienced by residents as seen through annual economic benefit and increased value of real estate.
What isn’t included here is investment made by broadband providers or sweat equity donated by countless community leaders and members to work to making better broadband happen. Unfortunately it’s difficult to measure that effort so we have focused on quantitative measures to appreciate the value.
You can see from the chart that in Beltrami, Crow Wing and Goodhue the return on investment (ROI) is immediate. That is because have much higher populations than Lake and Sibley Counties – so there are more people to use and benefit from the connection.
In Sibley County, the annual economic benefit is almost the same as the cost (about $1 million difference) so they will see a positive ROI in just over a year.
In Lake County the economic benefits will surpass the public investment in just over six years.
An important factor here is that we are looking at public investment. These are low interest loans, grants or bonding. The community pays in (via taxes in one way or another) and the community reaps benefits.
The financials for private funding – for the commercial provider for example – doesn’t work in the same way. For example, Paul Bunyan has borrowed $100 million to build the GigaZone (in and beyond Beltrami County). As a cooperative, enriching their members is a goal but community economic benefit will not help pay back the loan. It is one reason that the private sector needs the public sector to help offset costs of rural broadband – because it’s the community that benefits most.
The table below outlines specific dollar amounts.
Formulating Broadband Value
There are some formulas available that help quantify the value of broadband at the individual level:
- Using numbers from an earlier study by Ohio State University Swank Program, Roberto Gallardo at Purdue Extension determined that a rural home without broadband misses out on $1,850 in economic benefits per year.
- FTTH Council released a study showing access to fiber-delivered Internet boosts home values by up to 3.1 percent.
Using those formulas, here are the loosely calculated potential annual economic benefits realized by the counties:
| County | Public Investment | Annual Econ Benefit* | Real Estate Increase** |
| Beltrami | $1,432,000 | $38,631,700 | $102,593,266 |
| Crow Wing | $15,123,450 | $67,412,150 | $214,662,149 |
| Goodhue | $542,262 | $32,774,600 | $104,825,572 |
| Lake | $83,418,170 | $13,695,550 | $38,547,421 |
| Sibley | $9,850,011 | $8,604,350 | $20,162,085 |
* – Determined number of households served based on percent of broadband coverage and multiplied by $1,850
** – Determined number of households served based on percent of broadband coverage and multiplied that by 3% of average house sale amount in county
Public Investment
Public Investment includes grants, loans and other public or community funding. What isn’t included here are investments made by broadband providers, or the donated sweat equity of countless community leaders and members working to make better broadband happen. They meet monthly for years to create and deploy strategic plans; they write the proposals that garner public investment; they teach email or online banking at the library, or social media for businesses at the Chamber; they help distribute refurbished computers and help fellow parents learn to use the school’s parent portal. Unfortunately there isn’t a clear cut way to measure some community inputs so we have used only qualitative measures to appreciate the value.
Beltrami – $1,432,000
- $1.4 million to purchase and renovate the LaunchPad supported by Greater Bemidji, Northwest Minnesota Foundation, USDA Rural Business Enterprise Grant and Paul Bunyan Communications
- $32,000 in Broadband Innovation grants from Blandin Foundation
- Monthly meetings by leaders to plan for growth
Crow Wing – $15,123,450
- $5 million bonding for school technology (2002)
- $5 million ARRA funding to serve Crow Wing and Cass
- $2 million Minnesota Border-to-Border Broadband Grant (2015) to CTC to serve Crow Wing and Cass
- $3 million Minnesota Border-to-Border Broadband Grant (2016) to TDS to serve Crow Wing and Cass
- $123,450 from Blandin Foundation to support broadband adoption projects in the Resilient Region, which includes Crow Wing County
- Monthly meetings by leaders to plan for growth
- Blandin Broadband Community (2015-16), which requires considerable time from community leaders
Goodhue – $542,262
- $115,934 Minnesota Border-to-Border Broadband Grant (2015) to N-U Telecom
- $332,328 Minnesota Border-to-Border Broadband Grant (2016) to N-U Telecom
- $94,000 from Blandin Foundation for broadband adoption projects
- Blandin Broadband Community (2015-16), which requires considerable time from community leaders
Lake – $83,418,170
- $56.3 million ARRA loan
- $10 million ARRA grant
- $17 million county investment
- $118,170 from Blandin Foundation for broadband adoption projects
- Blandin Broadband Community (2013-14), which requires considerable time from community leaders
Sibley – $9,850,011
- $8.7 million Generally Obligated Tax Abatement Bond (between Sibley and Renville Counties)
- $1 million Minnesota Border-to-Border Broadband Grant (2015) to RS Fiber
- $150,011 from Blandin Foundation for broadband adoption projects
- Blandin Broadband Community (2015-16), which requires considerable time from community leaders