Image: County Data Conclusions
County Data Conclusions
We gathered data on each county but it is difficult to track impact, because while the impact may be immediate, the tools that measure impact are not. Often the most recent data available dates from 2015 or 2016, before some of the networks had reached a critical mass (80 percent served).
Here is what we can glean from the statistics:
Beltrami County had reached critical mass served by 2012, so we can glean the most from the statistics about the impact of broadband from Beltrami County. Here’s what we found:
- 2016 Population (46,101) is up 3.7 percent from 2010. The statewide average was 4.1 percent, but 80 percent of that growth is attributed to urban counties. The MN State Demographic Center calls Beltrami a Town/Rural County, noting that Town/Rural Mix counties as a group have experienced population losses since 2010. Beltrami has bucked that trend.
- 2015 Median Income is $44,757; that compares favorably to similar communities (Defined as Large Towns), where the median is $40,700.
For the other counties, the statistics are interesting but not reliably informative because there is little overlap between acquiring a critical mass of broadband access (80 percent) and the time statistics were gathered.
The exception is the real estate pricing and trends gleaned from Zillow; although there aren’t any obvious correlations.
Population Change
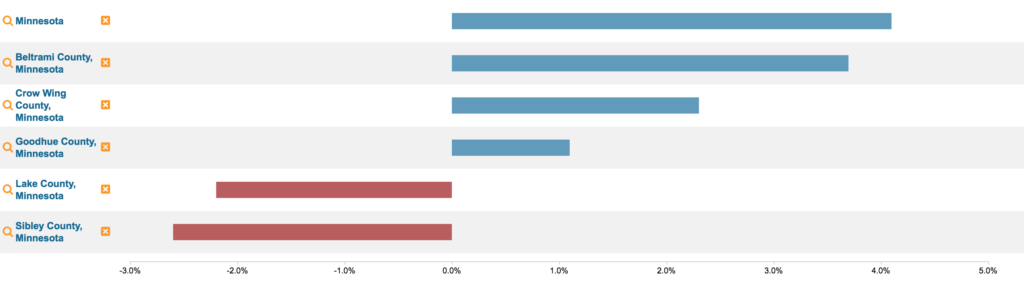
| Population by Year | 2010 | 2016 |
| Minnesota | 5,303,925 | 5,519,952 |
| Beltrami | 44,442 | 46,106 |
| Crow Wing | 62,500 | 63,940 |
| Goodhue | 46,182 | 46,676 |
| Lake | 10,866 | 10,625 |
| Sibley | 15,226 | 14,827 |
Digital Divide Stats
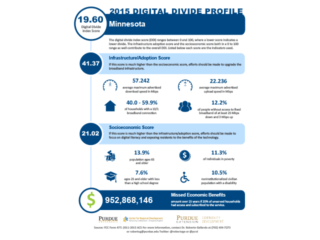
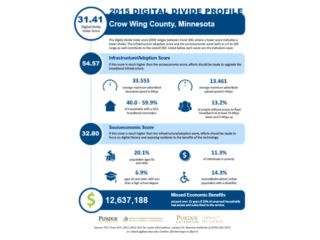
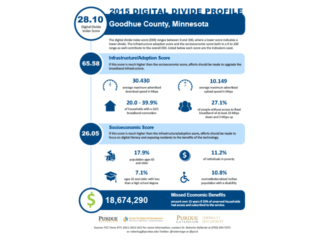
Roberto Gallardo of the Purdue Center for Regional Development, provides Digital Divide Profiles for each county and for Minnesota as a whole. The profiles track propensity for a digital divide based on infrastructure and existing socioeconomic factors. (The digital divide index score (DDI) ranges between 0 and 100, where a lower score indicates a lower divide.)
The DDI is a good way to look at what challenges you have to face to encourage ubiquitous adoption of broadband. You need infrastructure and you need to reach out to people who statistically are non-adopters. Including older people, people without a high school degree, people in poverty, and people with disabilities.
But as the counties in this study have demonstrated – a higher digital divide score does not mean you are relegated to a higher digital divide. Despite higher scores than average for both Infrastructure and socioeconomic assets all five counties are thriving with better broadband.
| Area | DDI | Infrastructure / Adoption | Socioeconomic |
| Minnesota | 21.51 | 41.37 | 21.02 |
| Beltrami | 33.04 | 48.66 | 30.87 |
| Crow Wing | 37.58 | 54.57 | 32.80 |
| Goodhue | 39.62 | 65.39 | 26.05 |
| Lake | 44.04 | 62.25 | 36.24 |
| Sibley | 40.61 | 65.84 | 27.26 |
Digital Divide Profile Reports


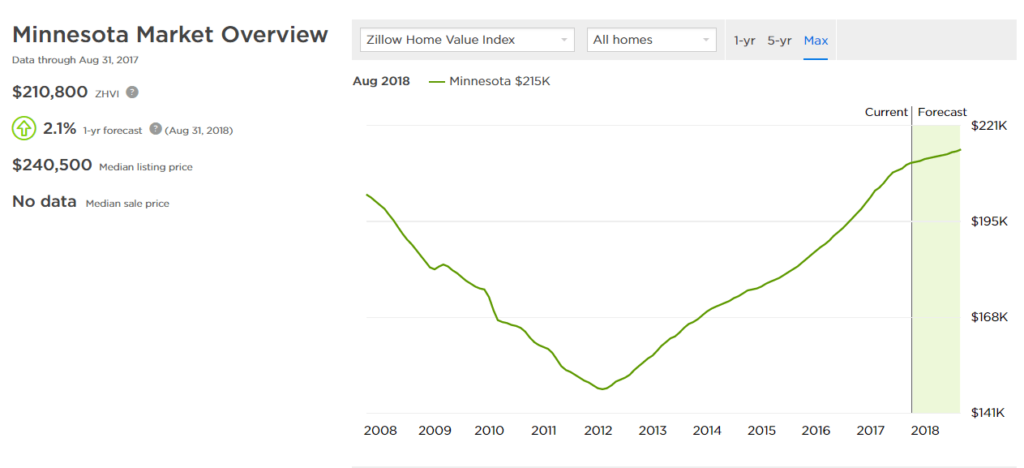
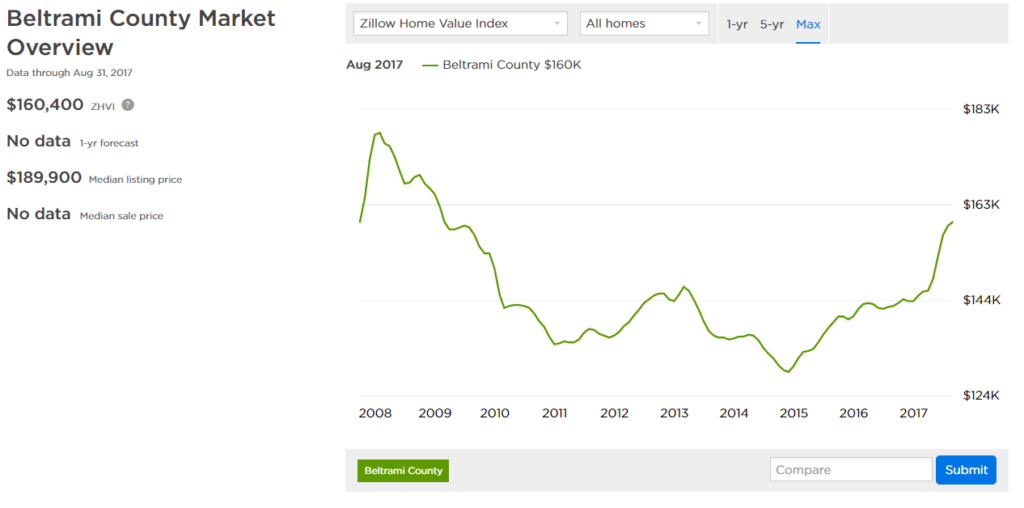
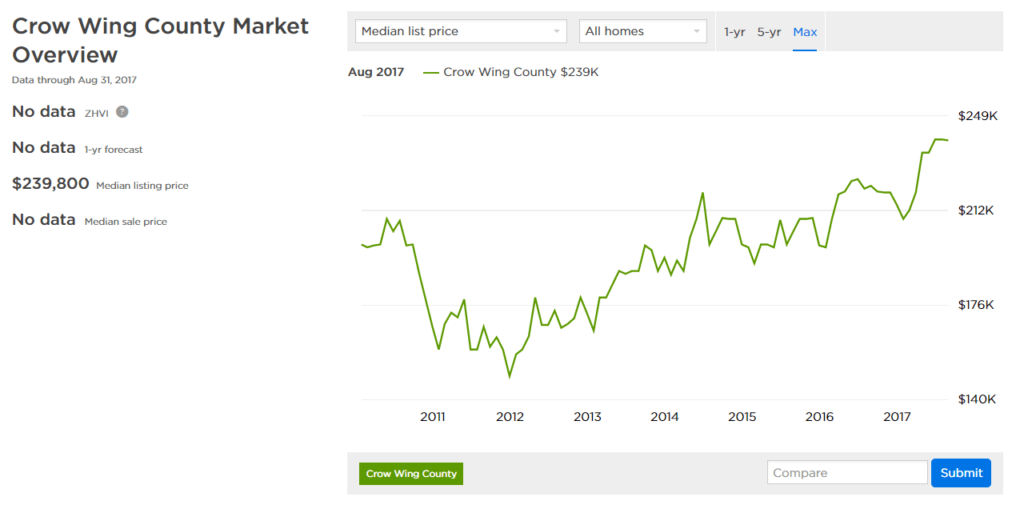
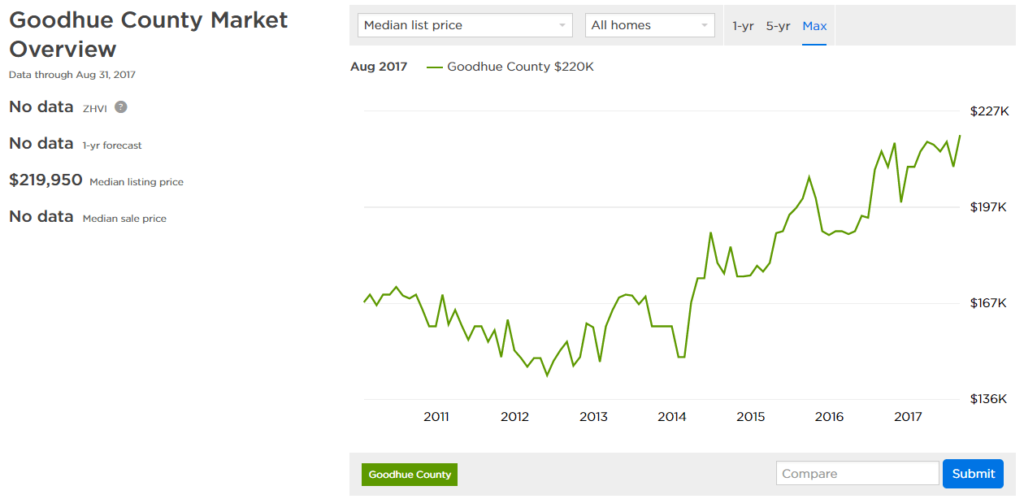
Real Estate Trends
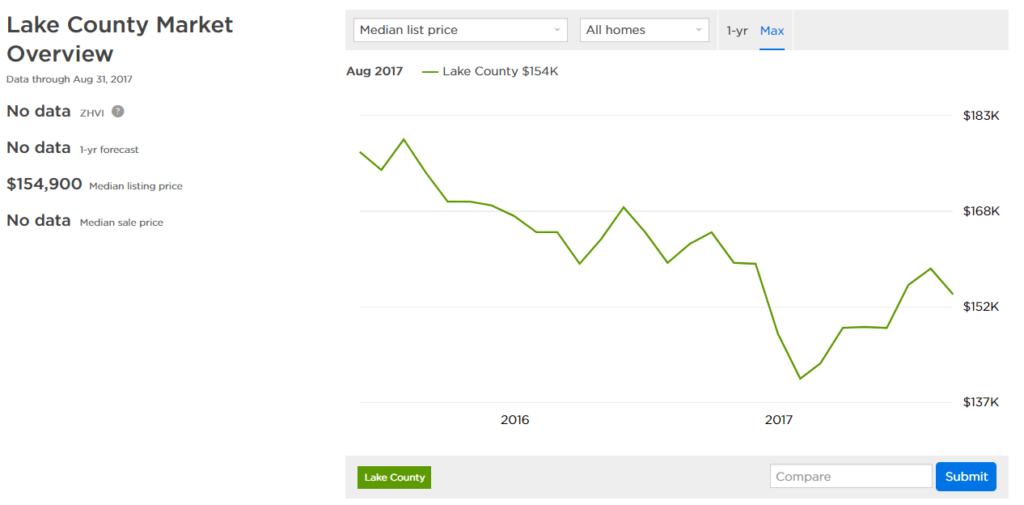
Most of following graphs come from Zillow and track housing prices from 2008 to July 2017. (Unfortunately they do not archive rates for Sibley County; Lake County only tracks two years.) You can see a statewide trend up around 2012.
It looks as if most the counties have followed suit with the state. There are two apparent diversions from the overall trend.
- Lake County house prices are increasing most recently, which could coincide with access to broadband but that connection is tenuous.
- Beltrami County saw an increase in house prices in 2012, when the rest of the state saw a decline. They did have broadband at that time. But again the connection is not clear cut and they did see a decline three years later.
Broadband Speeds Over Time
Minnesota has been striving for ubiquitous broadband since 2010. But broadband definitions have changed over the years. Before 2015, the broadband speed goal was 10-20 Mbps down and 5-10 Mbps up (measure at 10/6 or 10/5). Now the goal is 25 Mbps down and 3 Mbps up (25/3) by 2022 and 100/20 by 2026. The chart below tracks percentage population in a community with access to broadband; the data point (2016) tracks what percentage of the population meets the 2026 goals (or 100/20).
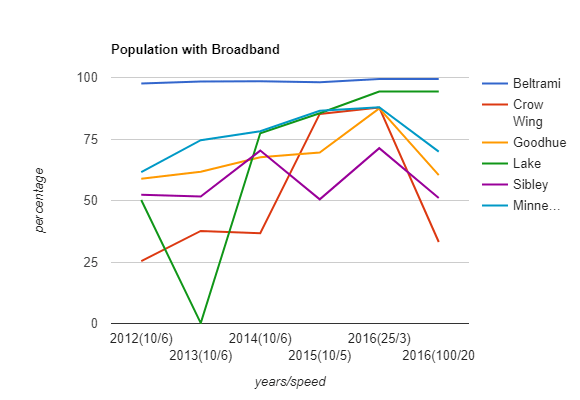
You can see where some communities hit their stride – perhaps due to outside funding. You can also track which communities are building with fiber based on whether their line dips at 2016 (100/20). Currently Lake and Beltrami Counties are best poised for meeting those goals.
Here are the years that each community crossed the 80 percent served mark:
- Beltrami – 2012 (or earlier)
- Crow Wing – 2015
- Goodhue – 2016
- Lake – 2015
- Sibley – not yet accomplished
Percentage Served over Time
The number is orange when a county’s broadband rate was close to or above state rate.
| Year | 2012 (10/6) |
2013 (10/6) |
2014 (10/6) |
2015 (10/5) |
2016 (25/3) |
2026 (100/20) |
| Minnesota | 61.57 | 74.53 | 78.16 | 86.46 | 87.94 | 69.86 |
| Beltrami | 97.61 | 98.4 | 98.46 | 98.07 | 99.36 | 96.35 |
| Crow Wing | 25.38 | 37.62 | 36.66 | 85.21 | 87.78 | 33.13 |
| Goodhue | 58.84 | 61.65 | 67.62 | 69.48 | 87.46 | 60.33 |
| Lake | 50.19 | 0.17 | 77.32 | 85.46 | 94.32 | 94.32 |
| Sibley | 52.37 | 51.64 | 70.29 | 50.46 | 71.27 | 51.01 |
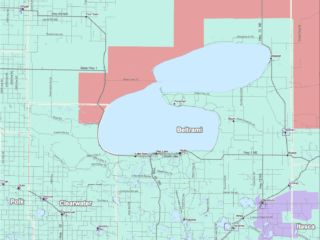
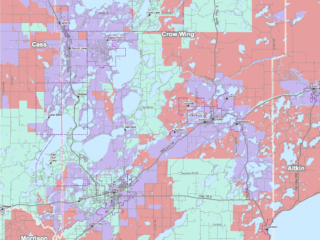
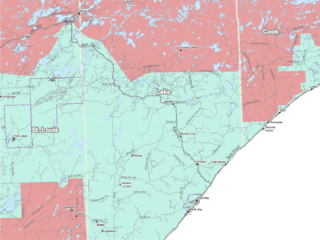
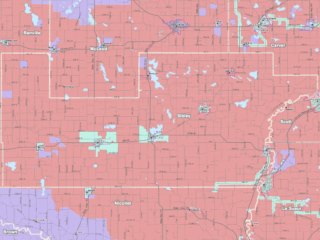
Broadband Maps
Maps of broadband access from the Office of Broadband Development (created April 2017).
- Pink = unserved (No wireline broadband of at least 25M/3M)
- Purple = underserved (wireline broadband of at least 25M/3M but less than 100M/20M)
- Green = served (wireline broadband of at least 100M/20M)